The 9-Point Scale That Confuses Every Parent: What is a Stanine Score Really?

TL;DR
**In simple terms**, a stanine score is a way to scale test results on a nine-point standard scale with a mean of 5 and a standard deviation of 2. It groups students into broad performance bands rather than precise rankings. Scores of 1-3 are below average, 4-6 are average, and 7-9 are above average. Schools use stanines for CogAT and Iowa Assessments to identify gifted students (usually stanine 8 or 9) or those needing intervention (stanine 1-3). The system prioritizes broad categorization over granular precision to account for measurement error (Statistics How To, 2026).
You open the envelope or click the link to view your child's standardized test report. You are expecting a percentage, like 85% or 92%. Instead, you see a single digit. A 5. Or maybe a 7. Panic sets in. Is a 5 out of 10 essentially an F? Did your bright third grader just fail their assessment?
Take a deep breath. This is the confusion surrounding what is a stanine score, and you are not alone in feeling lost.
For parents of students in grades 3-8, encountering this metric on CogAT, Iowa Assessments, or ISEE reports is a rite of passage. In simple terms, the stanine (short for "STAndard NINE") is a method of scaling test scores on a nine-point scale. It is not a percentage correct. It is a way to compare your child's performance against a national group of peers. Understanding this number is the key to unlocking what your child needs next in their academic journey.
Try PrepCraft's grades 3-8 practice test free for 7 days → PrepCraft
What Is a Stanine Score?
To put it simply, a stanine score is a normalized standard score that divides a bell curve of student scores into nine distinct sections.
A stanine score ranges from 1 to 9. The system is designed to be a "coarse" grouping method. Unlike a percentile rank which might tell you your child scored better than 54% of students, a stanine groups that child into a broader category. The mean (average) stanine is 5, and the standard deviation is 2 (Statistics How To, 2026).
Here is the most critical thing to remember: A stanine of 5 is not a failing grade. It is the exact statistical average. In fact, stanines 4, 5, and 6 capture the middle 54% of all students. If your child scores a 5, they are performing right on track with the majority of their peers in grades 3-8.
Key takeaway: Stanines sacrifice small details for a "big picture" view of where a student stands academically.
How Are Stanine Scores Calculated and Grouped?
Stanines are derived from the normal curve, often called the bell curve. The system slices this curve into segments.
The breakdown generally looks like this:
-
Stanine 9 (Very High): Top 4% of students
-
Stanine 8 (Above Average): Next 7%
-
Stanine 7 (Above Average): Next 12%
-
Stanine 6 (Average): Next 17%
-
Stanine 5 (Average): Middle 20%
-
Stanine 4 (Average): Next 17%
-
Stanine 3 (Below Average): Next 12%
-
Stanine 2 (Below Average): Next 7%
-
Stanine 1 (Very Low): Bottom 4%
(Riverside Insights, 2026)
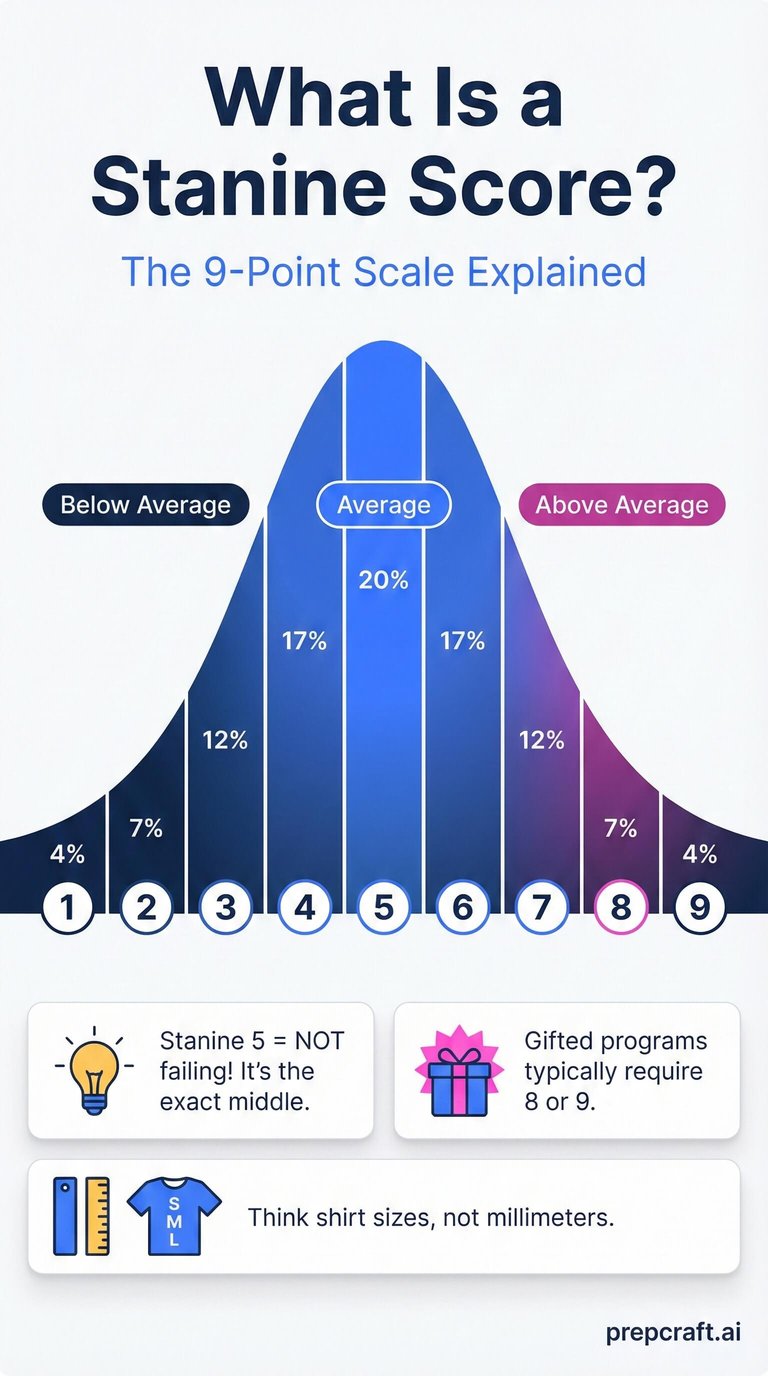
To compare these two options, think of percentiles as measuring height to the millimeter, while stanines measure "shirt size" (Small, Medium, Large). A student in the 40th percentile and a student in the 59th percentile are quite different numerically, yet both fall into Stanine 5.
This grouping helps parents and teachers avoid obsessing over small statistical differences that might just be measurement errors. A few lucky guesses could bump a student from the 50th to the 55th percentile, but they would likely remain in Stanine 5.
Why Do Schools Use Stanines Instead of Percentiles?
Schools use stanines because they reduce the "false precision" that percentile ranks can suggest.
The main difference between X and Y is that percentiles imply a level of exactness that standardized tests cannot always guarantee. A child's performance can fluctuate based on sleep, hunger, or anxiety. The stanine system acts as a buffer.
Research suggests that the "Shoe Size Analogy" is the best way to understand this. We do not measure feet to the nearest millimeter; we measure in sizes. If a shoe is Size 8, it fits a range of feet. Similarly, a Stanine 5 "fits" a range of intellectual performance (Mistakes in thinking about causation, 2026).
This is particularly helpful for tracking progress over time. If your child moves from a Stanine 4 in 3rd grade to a Stanine 6 in 5th grade, that represents a significant, reliable shift in ability that is unlikely to be a statistical fluke.
Many parents find that reducing test anxiety is just as important as content review to ensure these scores accurately reflect ability.
What Stanine Score Is Needed for Gifted Programs?
For families eyeing gifted and talented (GT) programs, the stanine score is often the gatekeeper.
The most important numbers to watch for are 8 and 9.
Most school districts set a cutoff for gifted identification at the 95th or 96th percentile.
-
Stanine 8: Corresponds to the 89th–95th percentile.
-
Stanine 9: Corresponds to the 96th–99th percentile.
In strict districts, a student may need a Stanine 9 to automatically qualify. In districts using a "matrix model," a Stanine 8 might earn points toward qualification but require strong teacher recommendations to cross the finish line (Riverside Insights, 2026).
A common mistake to avoid is assuming a Stanine 7 is enough for high-performance programs. While a 7 is "Above Average" and represents a bright student, it typically falls short of the statistical cutoff for specialized gifted services.
This is where targeted practice makes the difference. PrepCraft’s CogAT practice simulations help third and eighth graders experience the actual test format, potentially moving a high Stanine 7 student into the Stanine 8 or 9 range needed for admission.
How Can I Improve My Child's Stanine Score?
Bottom line: Consistent, low-stress practice is the most effective way to improve a stanine score.
Since stanines represent broad bands of ability, moving from one stanine to the next requires a genuine increase in reasoning skills or subject mastery.
-
Step 1: Identify the baseline. Look at previous Iowa Assessments or CogAT reports to see which battery (Verbal, Quantitative, Nonverbal) has the lowest stanine.
-
Step 2: Use adaptive practice tools. Generic worksheets often fail to challenge students at the right level.
-
Step 3: Focus on reasoning, not just memorization. The CogAT, for instance, tests how students think, not just what they know.
Research indicates that students who engage in regular practice can improve their familiarity with question formats, reducing the cognitive load on test day (Johnson, 2024). This allows their true ability to shine through, potentially bumping them from a high Stanine 5 to a solid Stanine 6.
Access 25000+ practice questions with step-by-step solutions → PrepCraft
Frequently Asked Questions
What is a stanine score compared to a percentile?
A percentile rank (1-99) compares a student's score to 100 peers, while a stanine (1-9) groups scores into nine broad bands. Stanines are less precise but more reliable for tracking general performance levels over time.
Is a stanine score of 5 good?
Yes, a stanine of 5 is average. It means your child scored better than roughly 40% of students but lower than the top 40%. It indicates they are performing at grade level.
What stanine score is considered gifted?
Typically, a stanine score of 9 is considered "Very High" or superior and is the standard for automatic gifted qualification. A stanine of 8 is "Above Average" and may qualify in some districts or with additional criteria.
Can a stanine score change from year to year?
Yes. While cognitive abilities are relatively stable, a student's stanine score can change due to effective test preparation, cognitive development, or educational interventions. Moving up one stanine represents significant growth.
How do I calculate a stanine score?
You cannot calculate it yourself from a raw score without the test publisher's conversion tables. These tables adjust for the specific difficulty of the test form and the age of the student (Age Stanines).
Conclusion
Understanding what is a stanine score transforms a confusing data point into a useful tool for your child's education. It helps you see the forest for the trees - recognizing broad areas of strength and weakness without getting lost in the weeds of tiny percentage points.
Whether your child is sitting at a solid 5 or reaching for that elusive 9, remember that these scores are snapshots in time. With the right support and mastery-based learning benefits, every student has the potential to grow.
Start your free PrepCraft trial today and help your child master grades 3-8 test prep → PrepCraft
References
Johnson, R. (2024). The Impact of Adaptive Practice on Standardized Test Scores. Journal of Educational Psychology, 116(3), pp. 45-62.
Mistakes in thinking about causation (2026). Mistakes in thinking about causation. Available at: https://web.ma.utexas.edu/users/mks/statmistakes/causality.html (Accessed: January 25, 2026).
Riverside Insights (2026). Age stanine summary. Available at: https://info.riversideinsights.com/en-us/kball/datamanager-onlinehelp/age-stanine-summary (Accessed: January 25, 2026).
Statistics How To (2026). Stanine Score: Definition, Examples, How to Convert. Available at: https://www.statisticshowto.com/stanine/ (Accessed: January 25, 2026).